How to do Failure Mode and Effect Analysis (FMEA)
FMEA can help teams to manage risk in product and software development projects. But what is it, why would you want to use it, and how do you use it in your projects? Check out this guide to find out.
FMEA explained:
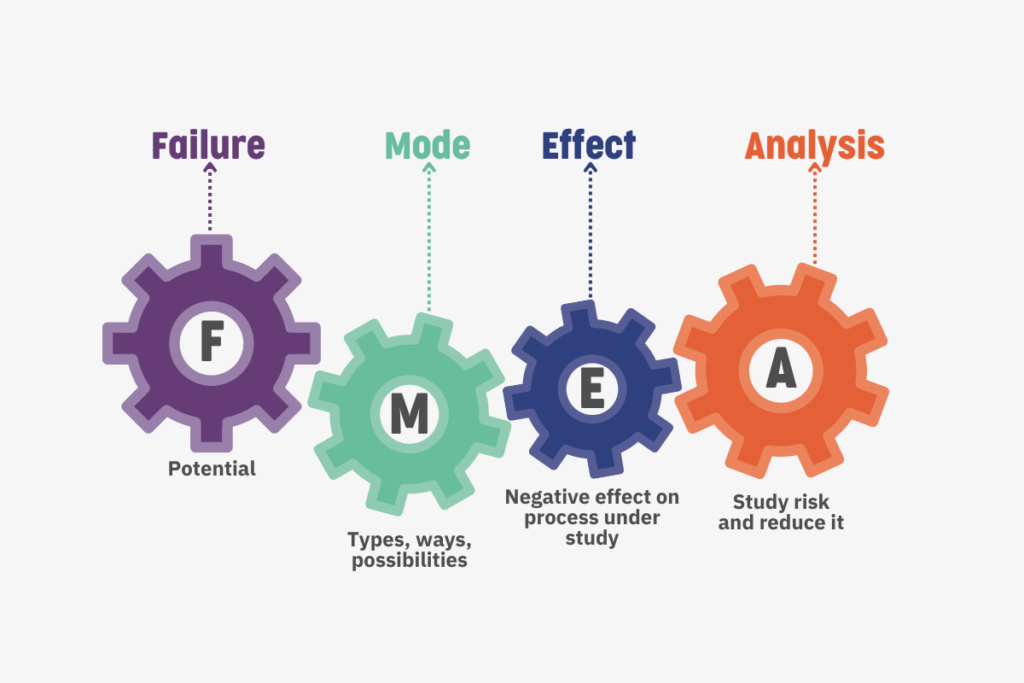
Failure Mode and Effect Analysis (FMEA) is a proactive approach to identifying possible process failure analysis which could result in unintended and potentially harmful consequences.
Finding potential failures earlier allows measures to be introduced to reduce the likelihood or severity of issues before they occur. Originally from military use to analyse manufacturing processes, FMEA can be applied to processes in software and product designs, use, systems, and services as required.
A team would use FMEA to identify the different ways something might fail, the causes and effects of failure, and any mitigating actions. They also score the probability and severity of each risk, which gives an overall risk rating and allows mitigations to be prioritised.
The outcome of the FMEA process is a risk register: a living document that logs things that could go wrong.
You might use FMEA when:
- You begin a project.
- A new cycle begins, such as a product lifecycle phase or an Agile sprint.
- There are design decisions to be made.
- You must comply with regulations.
- A customer reports a problem.
What are the benefits of FMEA?
The benefits of doing FMEA can include the following:
- Improved product quality, reliability, and safety due to pre-empting and mitigating failures. Giving the user an improved experience of the product.
- Reduces the chance of catastrophic failure leading to complete loss of service or risk to life.
- Reduces additional costs of fixing severe issues later in a project.
- Identifies any single points of failure and system interface issues early so you can address them.
- Evaluation of proposed changes, helping to select more reliable and safe designs.
- Catches anticipated faults using the early creation of targeted tests.
- Troubleshooting faults and performance issues.
- Shares knowledge between the teams and stakeholders to improve quality and understanding.
How do you do it?
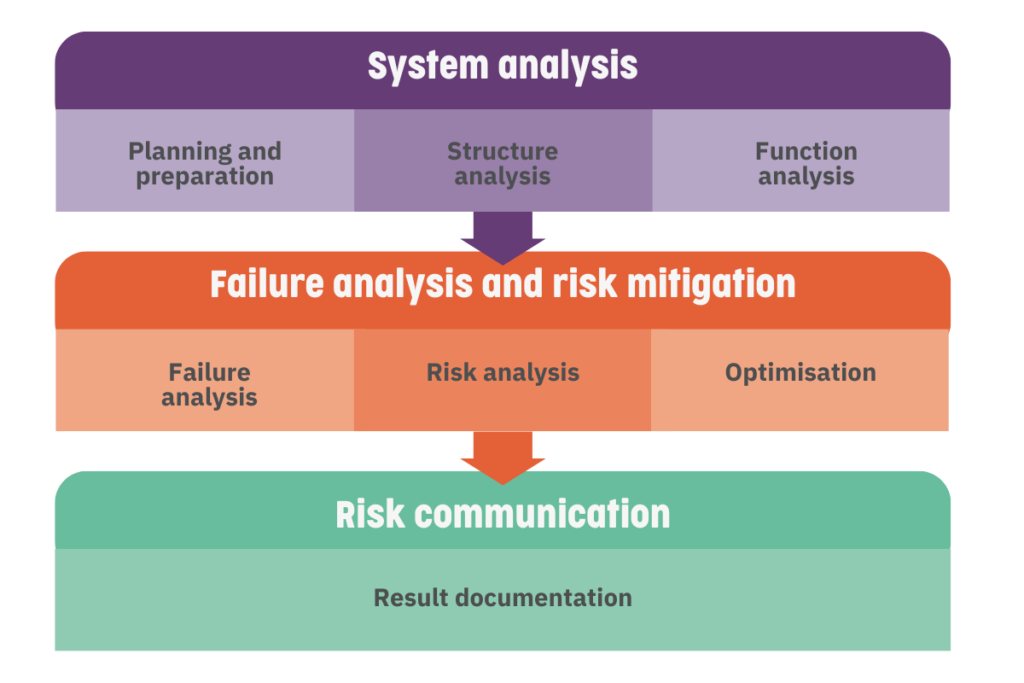
There are variations on how to do FMEA, but we have selected a common 7-step approach. This divides activities into three main stages: system analysis, failure analysis and risk mitigation, and risk communication.
Phase one: System analysis
Preparation and planning
Define the purpose and scope of the activity. Managers might look to answer the following questions:
- Will you cover specific functionality or processes?
- What is not in scope?
- Who are the subject matter experts and people who need to be involved? It is best practice to have a truly cross-functional team involved who have lots of different perspectives and broader knowledge.
- When does it need to be conducted and reviewed?
- How will you perform the FMEA analysis?
For example, we might consider a device with AI functionality, a printer, and cloud connectivity. Our scope might include the AI and the cloud connection, but not the printer that another company manufactures. We would probably want our AI expert to join in the assessment, as well as the project manager, team lead, and some senior managers. Technical people will evaluate the system diagrams, interfaces, and code. UX might assess the user interface from a user perspective or have a separate FMEA analysis completed just for this.
Structure analysis
Using the scope defined during the planning, identify the components to cover. These could be the different systems, interfaces, or processes to be assessed and will vary depending on the type of FMEA you are performing. Using a flow chart to visualise these steps can help with shared understanding.
For the connected AI device example, we would create a flow diagram showing the device, internal components, and interfaces to the printer and cloud.
Function analysis
Explore what the product should be doing at each step. What are the success criteria for each function performed? You can add more details about each function, such as how it works.
For example, the functions of our AI device might include the medical diagnosis it produces and the security protocol it uses to send the outcome to the cloud.
Phase two: Failure analysis and risk mitigation
Failure analysis
Using the elements identified during the Function Analysis, identify the failure mode (type of failure) and the corresponding causes and effects:
- Failure mode: One way the product can fail; for example, a defect or an inadequacy.
- Cause of failure: A possible failure investigation.
- Effect of failure: The consequences of the failure.
These links are also known as a “Failure Chain”.
Critical thinking and a diverse range of people can be beneficial at this stage to help identify a broader range of failures and causes.
Types of failure could include a loss of function, partial or intermittent function, unintended behaviour, exceeding function, lag or delays, or reduced function.
Failures for our AI device could be a user misinterpreting the accuracy of the result displayed on the screen (failure mode) if the accuracy was unclear in the UI (cause) and making a medical decision to prescribe a hazardous medication (effect). For the cloud component, a memory overflow (cause) could corrupt the data transferred to the cloud (failure mode), and vital patient information is lost (effect).
Risk analysis
For each failure mode, score the severity and probability and use these to calculate the overall risk. Probability is how likely the fault is to occur, and the severity is how harmful the consequences are. We typically score these between 1 – 5, but you could use a 1 – 10 scale if you need more range of severities. The Risk score is calculated based on these ratings.
Probability scores:
| Score | Meaning |
| 1 | Extremely unlikely (almost impossible) |
| 2 | Remote (relatively few) |
| 3 | Occasional |
| 4 | Reasonably possible (repeated failures) |
| 5 | Frequent (failure is inevitable) |
Severity scores:
| Score | Meaning |
| 1 | No relevant effect on reliability or safety. |
| 2 | Very minor, no damage, no injuries, and minor impact. Only noticed by expert users. |
| 3 | Minor failure, low damage, and light impact. Noticed by the average user. |
| 4 | Critical failure, loss of major functions, severe injury, severe damage, only one step away from catastrophic failure or death. |
| 5 | Catastrophic. Complete operation failure or loss of life. |
Some FMEA approaches also include evaluating additional factors:
- Detection—can the fault be detected by users? Scored between 1 – 6. A score of 1 means a test will definitely find the fault, and 6 is an undetected fault.
- Dormancy period—how long (time measurement) does it take for the failure to become known?
- Indication—if the product still operates, is it still safe? Could it contribute to a second failure mode? If it does, would this be obvious to users?
You calculate the overall risk score by multiplying the probability and severity scores or by using a chart based on the probability and severity scores:
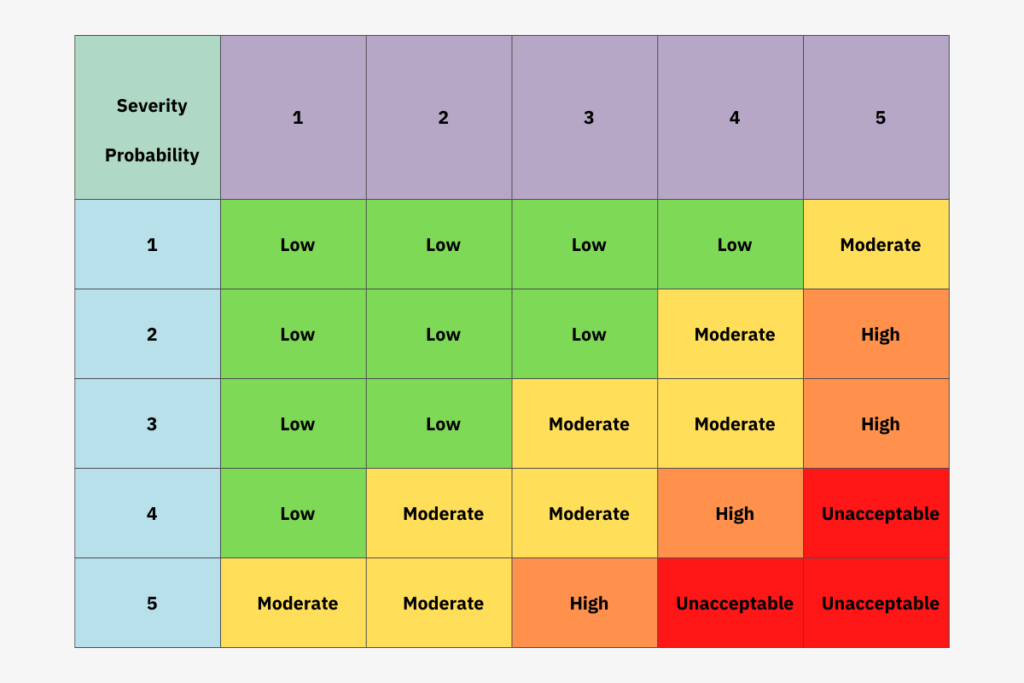
We might score the AI component a 4 for probability, as many users might be unaware that the accuracy was low. And a score of 5 for severity because a patient could die if given the wrong medication following a misdiagnosis. The overall risk score would be 20 and an “Unacceptable” failure category.
Optimisation
Work together to plan mitigations for the identified risks, and reassess the effectiveness of the optimisation—re-score the risks after identifying mitigations to see how successful these would be. Assign ownership to any actions and assign deadlines.
The AI expert and the UX stakeholder plan to update the device’s information messages to show the accuracy value, and additional training could reduce the risk of misinterpreting the displayed accuracy. The development team also plan to add safety checks and tests to the device’s memory usage to catch memory overflow issues. Both of these activities reduce the score to an acceptable level post-mitigation.
You might want to add additional requirements and tests for products for regulated markets, tracing them back to the risk ID.
Phase three: Risk communication
Result documentation
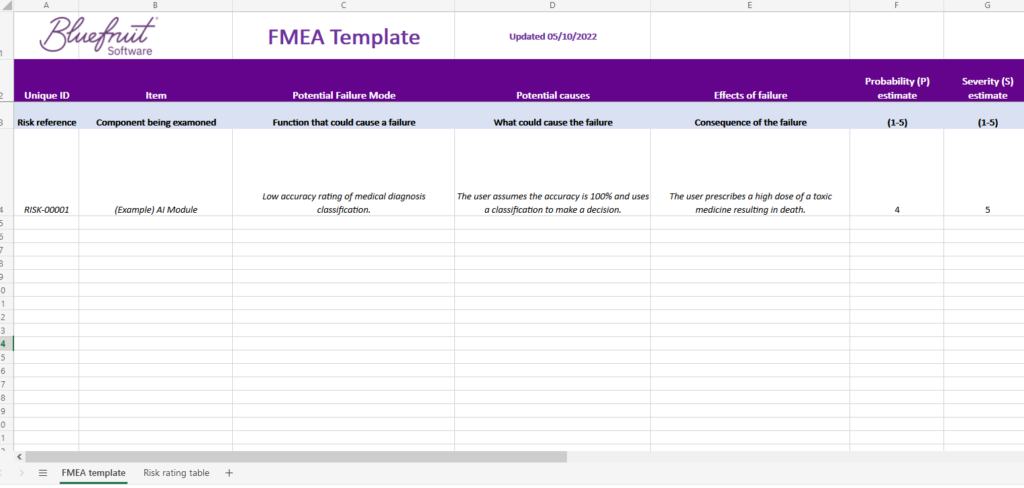
Document and communicate the results, for example, in a risk register spreadsheet. Capture the relevant details, including scores, notes, activities, and owners.
We could store our example risk register in a shared location, and an action to review it could be added to the “Definition of Ready” for a sprint. We could also email the document link to the broader team and add it to the project’s living documentation structure.
FMEA Excel template
We have created a helpful FMEA Excel template for you to use to get started.
Tips for getting FMEA right
If you can see why this is valuable, and want to give it a try, here are some tips to improve its success:
Begin early! The sooner you do this, the sooner you can plan work to mitigate risks.
Revisit it regularly. A risk register completed right at the start of the project and not revisited will quickly go out of date. Especially if you are following an Agile methodology and the scope changes as the project progresses.
Repeat the activity as a part of change planning or product design decisions. Considering the impacts of suggested changes can help select the best design option.
Assign owners to actions. Having an owner responsible for managing actions creates accountability, even if the owner isn’t the person completing the task.
Consider a digital solution. If you have many plans and documents linked to the main risk register, consider storing them digitally, so they are more easily accessible.
FMEA can’t plan for all risks, but you can be ready for them
Hopefully, you’ve found this blog post helpful. FMEA can help a lot in identifying possible failures. But the risk register it helps teams create can only go so far in helping you manage failure and risk.
If you’d like to learn more about risk in software development, software failure and how to reduce it further, download your copy of Why is psychological safety critical to managing software risk? today.
Why is psychological safety critical to managing software risk? will help you:
- Understand the four stages of psychological safety.
- See how psychological safety impacts risk in teams and whole organisations.
- Learn practices that help drive innovation and reduce risk.
FMEA can’t plan for all risks, but you can be ready for them
Hopefully you’ve found this blog post helpful. FMEA can help a lot in identifying possible failures. But the risk register it helps teams create can only go so far in helping you manage failure and risk.
If you’d like to learn more about risk in software development and how to reduce it further, download your copy of Why is psychological safety critical to managing software risk? today.
Why is psychological safety critical to managing software risk? will help you:
- Understand the four stages of psychological safety.
- See how psychological safety impacts risk in teams and whole organisations.
- Learn practices that help drive innovation and reduce risk.
Written by Jane Orme
Download your ebook and answer:
Did you know that we have a monthly newsletter?
If you’d like insights into software development, Lean-Agile practices, advances in technology and more to your inbox once a month—sign up today!
Find out more